
#
Activity Diagram

This tutorial explains to you what a UML Activity Diagram is. Here are the concepts explanation and an example.
In UML, an activity diagram is used to display the sequence of activities. Activity diagrams show the workflow from a start point to the finish point detailing the many decision paths that exist in the progression of events contained in the activity. In this diagram we can have parallel execution as well.
Here is an Activity Diagram in UML:
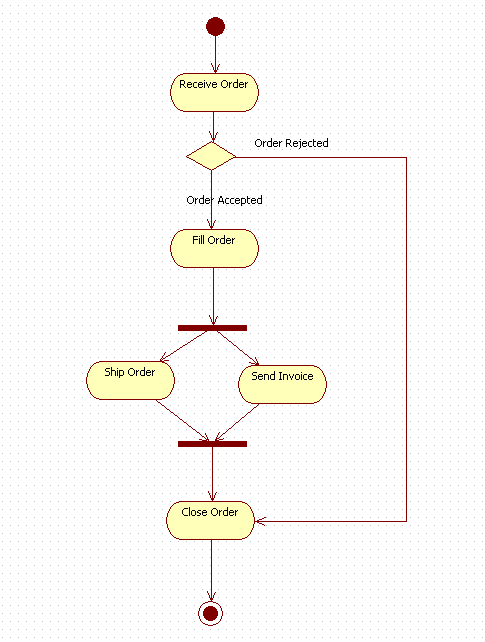
An initial or start node is depicted by a large black spot as shown above.
An activity is the specification of a parameterized sequence of behavior. An activity is shown as a round-cornered rectangle enclosing all the actions, control flows and other elements that make up the activity. "Receive Order", "Fill Order", "Ship Order", "Send Invoice" and "Close Order" are activities.
A control flow shows the flow of control from one action to the next. Its notation is a line with an arrowhead.
Decision nodes and merge nodes have the same notation: a diamond shape. They can both be named. The control flows coming away from a decision node will have guard conditions which will allow control to flow if the guard condition is met.
Forks and joins have the same notation: either a horizontal or vertical bar (the orientation is dependent on whether the control flow is running left to right or top to bottom). They indicate the start and end of concurrent threads of control.
The filled circle with a border is the ending point. An activity diagram can have zero or more activity final nodes.
The flow final node is depicted as a circle with a cross inside.