
#
State Machine (Statechart) Diagram

This tutorial explains to you what a UML State Machine Diagram is. Here are the concepts explanation and an example.
A state machine diagram models the behavior of a single object, specifying the sequence of events that an object goes through during its lifetime in response to events. State machine diagram is a behavior diagram which shows discrete behavior of a part of designed system through finite state transitions.
Here is an example:
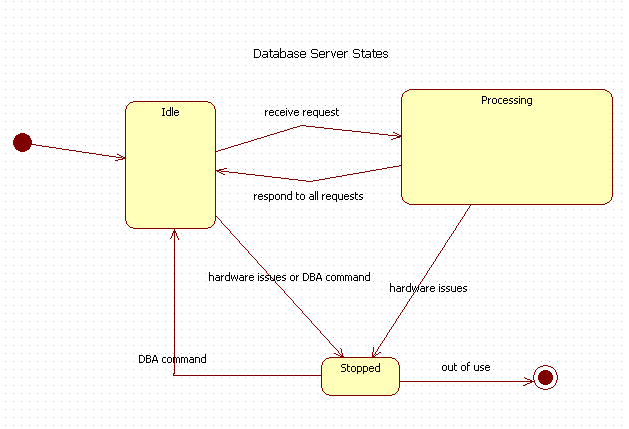
Each state diagram typically begins with a dark circle that indicates the initial state and ends with a bordered circle that denotes the final state. Sometimes, the Final State is not used.
The main elements that state diagrams depict are states and transitions. States are captured by rectangles with rounded corners that are labeled with the name of the state. Transitions are marked with arrows that flow from one state to another, showing how the states change.
For a database server, I presented 3 states: Idle, Processing and Stopped. The transitions tell you how a database server can be in that state.
For instance for a database to be idle there are 2 situations:
- the server is stopped and the database administrator (DBA) start the database;
- the server is processing, but at one moment there are no database requests.
A server cannot be in the "Processing" state without passing through "Idle" state.
This is an easy diagram, but sometimes you can have to draw a more complex diagram.