
#
Timing Diagram

This tutorial explains to you what a UML Timing Diagram is. Here are the concepts explanation and an example.
Timing diagrams are used to explore the behaviors of objects throughout a given period of time. UML timing diagrams are used to detail interactions based on time. With Timing Diagrams you'll describe when an event occurs, how long it takes for other participants to react and how long they'll take to complete an interaction. UML timing diagrams are used to display the change in state or value of one or more elements over time. It can also show the interaction between timed events and the time and duration constraints that govern them.
Here is an example of UML timing diagram:
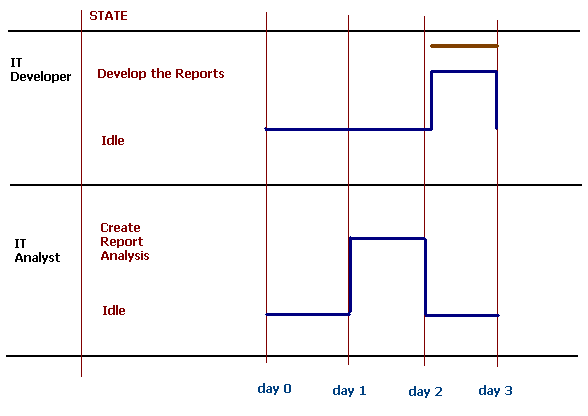
Here is some things to underline:
IT Developer and IT analyst there are 2 resources. You can see their states over time and how the state of one can influence the state of the other.
You can add time constraints (for instance where the brown line is drawn).
You can draw an arrow to show the event which cause the other resource to switch their state (For instance between A and B).